![]()
![]()
![]()
X. Bai, W. Jingzhong and Ch. Qi
Qinghai Academy of Animal and Veterinary Sciences, Xining 810003, Qinghai, P.R. China
Body weight data were used to model growth curves by cubic equation and Brody's regression equation. The results show that the cubic equation is suitable for modelling the growth pattern of yak. Tianjun yak had the highest growth efficiency. Although Haiyan yak had the highest body weight, its growth rate was relatively lower than that of Tianjun yak.
Keywords: Growth function, Qinghai Lake, yak
Due to lack of scientific information on growth pattern of yak, the composition of yak herds tend to be ad-hoc. Herders have no idea on how to plan production cycle, e.g. a proper marketing strategy based on growth pattern of animals. As a result, the average age of animals in yak herds has usually been relatively high, which leads to lower production efficiency and severe grazing pressure on pastures.
Many equations have been proposed to model growth in animals, but only the index model, Logistic model, Brody model and Gompertz model have been used, to varying degrees, in predicting the growth patterns of livestock and poultry (Parks 1970; Zhang 1998; Zhang and Yang 1998). To date, these growth models have not been applied on yak. This study was conducted to identify mathematical equations, which can be applied to model the growth pattern in yak and to predict marketing age of yak.
Herds in three counties, Tianjun, Haiyan and Gonghe, in the areas surrounding the Qinghai Lake, Qinghai Province, were used for this study. All animals were maintained on natural pasture. Body weights were recorded by weighing 50 yak of similar ages in each group. Six and/or 7 age groups were available in the three respective herds studied in Haiyan, Tianjun and Gonghe counties (Table 1).
Table 1. The age points at which yak were weighed (years).
Sites |
W0 |
W1 |
W2 |
W3 |
W4 |
W5 |
W6 |
W7 |
Gonghe |
0 |
0.417 |
1 |
2 |
3 |
4 |
5 |
7 |
Tianjun |
0 |
1 |
2 |
3 |
4 |
5 |
7 |
|
Haiyan |
0 |
1 |
2 |
3 |
4 |
7 |
W0 = primary weight, W1 to W7 = weights taken at seven different age points.
Brody and cubic equations were used in this study to describe the growth pattern of yak. The mathematical expressions of these equations are:
Brody: W = a+b (1ñect).
Cubic equation: W = at3+bt2+ct+d,
where, W = body weight; t = time; and a, b, c and d are constants.
Generally, body weight of male yak was significantly heavier than that of female yak (P<0.01). However, there were no differences (P>0.05) in birth weight between sexes, within the same breed (Table 2). Growth efficiency of the three yak populations is illustrated in Figure 1. The figure shows that the Tianjun yak had higher growth efficiency (P<0.01) than Gonghe and Haiyan yak. Although Haiyan yak had the highest birth weight (P<0.01), its growth rate was lower.
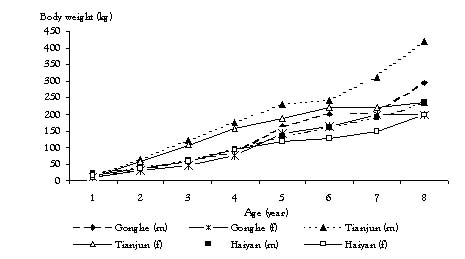
Figure 1: Production of yak in the areas surrounding the Qinghai Lake.
Table 2. Least square means of yak body weight.
Site |
W0 |
W1 |
W2 |
W3 |
W4 |
W5 |
W6 |
W7 |
Gonghe ♂ |
10.51 |
35.97 |
62.00 |
84.35 |
162.4 |
201.7 |
206.7 |
295.6 |
Gonghe ♀ |
10.25 |
32.30 |
46.58 |
76.19 |
143.2 |
162.5 |
198.0 |
198.5 |
Tianjun ♂ |
13.59 |
122.7 |
174.1 |
229.4 |
241.7 |
313.7 |
421.0 |
|
Tianjun ♀ |
13.14 |
109.4 |
158.3 |
188.3 |
221.0 |
221.8 |
236.7 |
|
Haiyan ♂ |
24.25 |
60.28 |
97.78 |
133.2 |
161.7 |
237.1 |
||
Haiyan ♀ |
18.85 |
57.99 |
94.18 |
120.9 |
128.7 |
197.8 |
W0 = primary weight, W1 to W7 = weights taken at seven different age points.
Zhang (1998) reported that Brody, Bertallanffy and Gompertz were the most suitable growth models for cattle and that the Brody equation gave the best fit. In this study, however, the cubic equation proved to be a more suitable growth model for yak (Table 3). In addition, the advantage of the cubic equation is that its first derivative provides an estimate of efficiency and every point on the cubic equation corresponds to a different efficiency value. Therefore, it can be used to analyse the efficiency of animal production.
Table 3. Parameters of growth model.
Growth model |
Male |
Female |
||||||||||
a |
b |
c |
d |
R2 |
a |
b |
c |
d |
R2 | |||
Gonghe |
Brody |
ñ8.4 |
329.5 |
ñ0.4 |
0.9 |
ñ55.3 |
255.4 |
ñ1.0 |
0.9 | |||
Cubic |
0.1 |
ñ2.2 |
51.3 |
10.9 |
1.0 |
ñ1.4 |
9.4 |
22.7 |
14.5 |
1.0 | ||
Tianjun |
Brody |
59.4 |
180.8 |
ñ0.7 |
0.9 |
15.9 |
232.8 |
ñ0.5 |
1.0 | |||
Cubic |
1.8 |
ñ20.5 |
114.2 |
17.8 |
1.0 |
1.4 |
ñ19.8 |
107.1 |
15.2 |
1.0 | ||
Haiyan |
Brody |
ñ55.8 |
295.0 |
ñ0.9 |
0.7 |
110.5 |
310.9 |
ñ0.9 |
0.7 | |||
Cubic |
ñ0.1 |
ñ0.6 |
38.5 |
23.7 |
1.0 |
0.7 |
ñ9.1 |
53.5 |
17.1 |
1.0 | ||
Production function, better known as a total physical production (TPP) in economics, can be used to obtain marginal physical production (MPP) and average physical production (APP). MPP is the amount of product output per unit of resource input. In mathematics, it can be defined as the first derivative of TPP, that is: MPP = dW/dt. TPP models in this study are all cubic equations, so MPP expression is: MPP = ex2 + fx + g. The three parameters, e, f and g are summarised in Table 4. APP is the average gain of animal within a certain period. Its mathematical expression is APP = TPP/year. In this study, APP decreased with age.
A desirable animal production system is that which is characterised by the highest productivity and the highest efficiency. To achieve this, production should be maintained at a point where the productivity (APP) is at its highest level while the resource output rate remains at a high level. Mathematically, the best status of animal production could be expressed as MPP = APP. To determine the best marketing time, we should also consider the relationship of resource input with the productive output. So, the age that best fits the relation MPP = APP is the appropriate marketing age. The results of this study indicate that the possible marketing age for both male and female yak in Gonghe is 2 years, while for male and female in Tianjun the right ages are 6 years and 1 year, and in Haiyan the corresponding ages are 4 and 6 years. However, due to the limited samples, this conclusion needs further confirmation.
Dexiang Z. and Shan Y. 1998. Study on the differences of growth model between male and female broilers. Chinese Journal of Heilongjiang Animal and Veterinary Sciences 3:11ñ12.
Parks J.R. 1970. Growth curves and physiology of growth. American Journal of Physiology 21:833ñ836.
Wenju Z . 1998. Study on growth curve function of Huicheng cattle. Chinese Journal of Gansu Animal and Veterinary Sciences 1:3ñ6.
![]()
![]()
![]()