![]()
![]()
![]()
T. Dorji,1,2 M. Goddard,2,3 J. Perkins,2 N. Robinson3 and W. Roder1
1. Renewable Natural Resources Research Centre, Jakar, Ministry of Agriculture,
Bhutan
2. Institute of Land and Food Resources, The University of Melbourne, Australia
3. Victorian Institute of Animal Sciences, Department of Natural Resources and
Environment, Attwood, Victoria, Australia
Eight cattle microsatellite markers were used for genetic analyses of three Bhutanese yak (Bos grunniens) populations (western, central and eastern). There was substantial genetic variability within yak populations, with average heterozygosity range of 0.644 to 0.680. Neighbour-joining tree constructed from Nei's standard genetic distances (Ds; Nei 1972) grouped western and central Bhutan yak in one clade (Ds = 0.01) separate from eastern Bhutan yak (Ds = 0.20 and 0.27, respectively). The genetic distances between the yak from eastern Bhutan and the other two regions suggest that the populations have been separated for at least 4000 years and that they have exchanged <2 migrants per generation. Based on these results, Bhutanese yak populations are categorised into two types: 1) western and central Bhutan yak, and 2) eastern Bhutan yak. Implications of these findings on yak conservation and breeding programmes are discussed.
Keywords: Bhutan, conservation, genetic distance, genetic diversity, heterozygosity, yak
Knowledge of the genetic relationships among breeds or populations of yak will be useful in planning for conservation of yak genetic resources, in designing breed comparison experiments and in predicting heterosis in crosses between breeds (Cai and Wiener 1995). Populations, which are genetically very different, should be considered for separate conservation. The genetic relationships among populations can be estimated from gene frequencies at microsatellite loci. The aim of this paper was to assess the genetic diversity within Bhutanese yak populations.
A total of 169 yak were sampled from three yak populations (western Bhutan 106, central Bhutan 32 and eastern Bhutan 31). No more than one-tenth of each herd or village population was sampled to ensure that the animals sampled were as far as possible unrelated. The eight cattle microsatellite loci studied were TGLA53, TGLA122, TGLA73, AGLA293, BM2113, BM1824, CSSM066 and ETH3. PCR amplification was performed on an OmniGene Thermal Cycler (Hybaid, UK). The number of alleles per loci, observed heterozygosity (Ho) and the unbiased estimates of heterozygosity (He) were estimated using computer package Biosys-1 (Swofford and Selander 1989). Dendogram was constructed using the neighbour-joining (NJ) method (Saitou and Nei 1987). Nei's standard distances (Ds; Nei 1972), observed heterozygosity (Ho) and expected heterozygosity (He), neighbour-joining trees and bootstrap values were computed using the computer package DISPAN (Ota 1993). The software MICROSAT version 1.4 (Minch 1996) was utilised for estimating fixation index (Fst) of Reynolds et al. (1983). From simulation studies, DA (revised Nei's genetic distance; Nei et al. 1983) has been shown to be superior for clarifying the evolutionary relationship of closely related populations, however, Ds was more appropriate for estimating evolutionary time (Takezaki and Nei 1996). As in the present data set there was no apparent difference in the tree topology obtained by DA and Ds, only the standard genetic distance of Nei (1972), was used. Approximate divergence time between yak populations was estimated by substituting distance values in the equation, Ds = 2at (Nei 1976), where t is the time of divergence between populations and a is the mutation rate. The value of a was assumed to be 1.1 ± 0.5 × 10⁻⁴ as derived by Crawford and Cuthbertson (1996) for microsatellite loci in sheep. The number of effective migrants per generation (Nm) was calculated from the equation E(Fst) = 1/(1 + 4Nm) (Reynolds et al. 1983).
Genetic variability parameters are presented in Table 1. There was no significant difference in the mean number of alleles per locus among the three yak populations. Similarly, the heterozygosity values among yak populations were not significantly different.
Table 1. Genetic variability parameters in yak populations.
Populations |
MNA |
SE |
Mean heterozygosity | |||
Ho |
SE |
He |
SE | |||
Western region yak |
7.6 |
1.1 |
0.621 |
0.052 |
0.674 |
0.053 |
Central region yak |
6.1 |
0.8 |
0.598 |
0.042 |
0.680 |
0.051 |
Eastern region yak |
4.8 |
0.6 |
0.601 |
0.069 |
0.644 |
0.044 |
| MNA = Mean number of alleles per loci; SE = standard error; Ho = observed heterozygosity; He = expected heterozygosity (Nei 1987). | ||||||
The genetic distance (Ds) values were 0.017 (SE: 0.009), 0.20 (SE: 0.04) and 0.27 (SE: 0.08) between western and central, western and eastern, and central and eastern populations, respectively. The Fst values were 0.013 (SE: 0.005), 0.09 (SE: 0.018) and 0.11 (SE: 0.03) between western and central, western and eastern, and central and eastern populations, respectively. The dendogram in Figure 1 supports the divergence of eastern Bhutan yak from other two populations with a bootstrap value of 93%. The divergence of western and central region yak occurred comparatively more recently (<1000 years ago) while eastern Bhutan yak population have diverged from western and central populations of yak between 4000 and 16,000 years ago, respectively. Nm estimates as 1.8, 2.5 and 19 between eastern and central, eastern and western, and western and central yak populations, respectively.
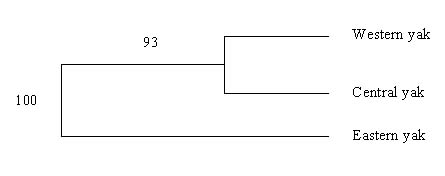
Figures at the nodes are bootstrap values of 1000 resampling with replacement.
Figure 1. Neighbour-joining tree of yak populations based on Ds.
The mean number of alleles per loci and heterozygosity values were not significantly different among the three yak populations. The high heterozygosity values indicate that inbreeding may not be a problem at the population level. However, observed heterozygosity was always lower than the expected ones (Table 1). It could be due to population subdivision in each region, local inbreeding or the presence of null alleles. Population subdivision can occur because of the geographical isolation of yak herds. The rugged topography and mountain barriers limit movement of yak and impose reproductive isolation. The local inbreeding might be enhanced by the dominance behaviour of the yak bull that prevents other bulls from mating (Steane 1997; Wiener 1997). Furthermore, we conceived that non-amplifying alleles might be segregating at some of the loci as all the microsatellites used were isolated in cattle B taurus.
The most striking result is the higher genetic distance values, which separate the eastern region yak from the western and central yak populations. Oral history mentions that the origin of eastern region herders could be traced to Tibet. Evidences from this study suggest that the eastern Bhutan yak population have diverged from the western and central populations of yak between 4000 and 16,000 years ago. If correct, the eastern yak population would have diverged from the other yak populations before or around the time of domestication. Alternatively, eastern region yak might have incorporated genes from geographically distinct strains of wild yak populations or through hybridisation with local cattle.
A common origin in Tibet could explain the close genetic similarity observed between the central and western yak populations. Also, it could be explained by genetic admixture following migration of individuals from one population to the other.
We can categorise Bhutan's yak population into two groups. Western and central region yak could be considered as single population, distinct from the eastern Bhutan yak. This result is important for developing a strategy for conservation purposes or designing a breeding programme. The eastern region yak represent a unique gene pool and therefore a separate conservation policy is needed. The differences in genetic distances indicate that significant heterosis may not be achieved from the current practice of crossing between central and western region yak.
We are indebted to Helvetas Bhutan for sponsoring the study. We acknowledge Mr Kinzang Wangdi, Dr Lham Tshering, Dr Pema Gyamtsho, Mr David Steane, Amanda Mitchelson, Thamy Balasingham, Gyem Tshering and Sithup Dorji for their support and co-operation.
Cai L. and Wiener G. 1995. The yak. FAO (Food and Agricultural Organization of the United Nations) Regional Office for Asia and the Pacific, Bangkok, Thailand. 237 pp.
Crawford A.M. and Cuthbertson R.P. 1996. Mutations in sheep microsatellites. PCR Methods and Applications 6:876–879.
Minch E. 1996. MICROSAT. Version 1.4. Stanford University Medical Centre, Stanford, USA. Http://lotka.stanford.edu/microsat/microsat.html
Nei M. 1972. Genetic distance between populations. American Naturalist 106:283–291.
Nei M. 1976. Mathematical models of speciation and genetic distance. In: Karlin S. and Nevo E. (eds), Population Genetics and Ecology. Academic Press, New York, USA. pp. 723–766.
Nei M., Tajima F. and Tateno Y. 1983. Accuracy of estimated phylogenetic trees from molecular data. Journal of Molecular Evolution 19:153–170.
Nei M. 1987. Molecular evolutionary genetics. Columbia University Press, New York, USA. 512 pp.
Ota T. 1993. Dispan: Genetic distance and phylogenetic analysis. Pennsylvania State University, University Park, PA, USA.http://www.bio.psu.edu/People/Faculty/ Nei/Lab/Programs.html.
Reynolds J., Weir B.S. and Cockerham C.C. 1983. Estimation of the co-ancestry coefficient: Basis for a short-term genetic distance. Genetics 105:767–779.
Saitou N. and Nei M. 1987. The neighbour-joining method: A new method for reconstructing phylogenetic trees. Molecular Biology and Evolution 4:406–425.
Steane D.E. 1997. Conservation and use of animal genetic resources in Asia—Its relevance to yak. In: Rongzhen Y., Xingtai H. and Xiaolin L. (eds), Proceedings of the 2nd International Congress on Yak held in Xining, P.R China, 1–6 September 1997. Qinghai People's Publishing House, Xining, P.R. China. pp. 43–49.
Takezaki N. and Nei M. 1996. Genetic distances and reconstruction of phylogenetic trees from microsatellite DNA. Genetics 144:389–399.
Swofford D.L. and Selander R.B. 1989. Biosys 1. A computer program for the analysis of allelic variation in population genetics and biochemical systematics\pard plain (release 1.7). University of Illinois, Urbana, Champaign, USA.
Wiener G. 1997. Yak breeds and utilization of genetic diversity. In: Rongzhen Y., Xingtai H. and Xiaolin L. (eds), Proceedings of the 2nd International Congress on Yak held in Xining, P.R. China, 1–6 September 1997. Qinghai People's Publishing House, Xining, P.R. China. pp. 50–53.
![]()
![]()
![]()